
Urban Climate Index
Urban Climate Index for Sydney City Council in August 2026: climate across 18 zones
Written by Eduardo Garcia · Co-founder / CEO / CTOPublished 21 August 2026
#Urban-Climate-Index#Sydney#Australia#August-2026
The Urban Climate Index for Sydney City Council, on the Tasman Sea, ranks the climate of August 2026 across 18 zones. Here are the five that lead and the five that close.
If you live here or you are considering it, you see which zones ran warmer or cooler that August, and where you want to be.
Warmer end of the ranking
St Peters leads toward the south, at about 23.0°C. Eveleigh and Beaconsfield follow. The best five:
Best five by the index. Urban Climate Index, Sydney City Council, August 2026.
| Rank | Zone | Surface |
|---|---|---|
| 1 | St Peters | 23.0°C |
| 2 | Eveleigh | 22.1°C |
| 3 | Beaconsfield | 22.6°C |
| 4 | Darlinghurst | 21.7°C |
| 5 | Paddington | 21.5°C |
Cooler end of the ranking
The cooler ground closes the index. Haymarket is last of 18, at about 19.9°C. City of Sydney and Moore Park sit in the worst five. Erskineville sits 15th with warmer ground than Haymarket, because it takes air and rain from other meteorological stations.
Worst five by the index. Urban Climate Index, Sydney City Council, August 2026.
| Rank | Zone | Surface |
|---|---|---|
| 18 | Haymarket | 19.9°C |
| 17 | City of Sydney | 20.5°C |
| 16 | Moore Park | 20.5°C |
| 15 | Erskineville | 21.5°C |
| 14 | Waterloo | 20.9°C |
Ground and stations this August
Five meteorological stations cover the 18 zones. Humidity is the same in all of them this August, 64%. Air sits around 15.3°C. Rain and the ground set one zone apart from another.
The August mean for Sydney City Council sits at 21.0°C. A single satellite day can run cooler or hotter; the 13th reached 13.8°C and the 29th 27.3°C.
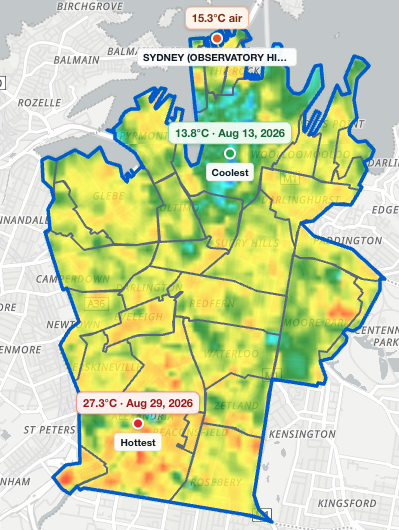
This map is Sydney City Council in August, on the Tasman Sea. The labels mark the coolest and hottest satellite days of the month, and the air at Observatory Hill.
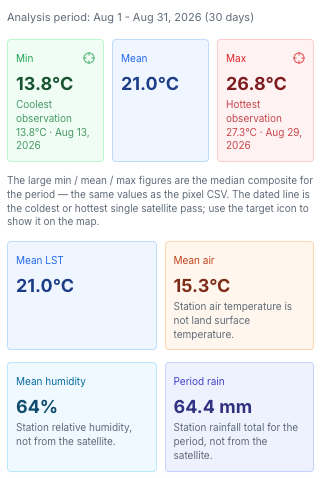
These figures are the August mean for Sydney City Council: 21.0°C ground. Air, humidity and rain come from the stations: 15.3°C, 64% and 64.4 mm.
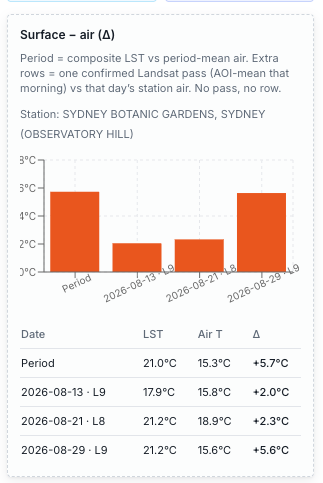
The ground sits hotter than the air: 21.0°C surface against 15.3°C. The index ranks with both readings.
Surry Hills sits in the middle of the index
Surry Hills sits 10th of 18, at about 21.2°C on average, in the middle pack. Anyone looking for warmer ground this August looks toward St Peters, Eveleigh and Beaconsfield.
How this August is built
This August brings together the usable satellite scenes after the cloud filter. Ground and station air are two different readings; the index uses both.
Other cities and months are on our blog.
Conclusion
In August the satellite sees warmer ground toward the south and cooler ground toward Haymarket. The mean for Sydney City Council sits at 21.0°C.
St Peters leads and Haymarket closes.
Knowing this, where do you want to be next August in Sydney City Council, on the Tasman Sea?
Questions
What do I do with this ranking?
It ranks that August’s climate for people who live here or are considering it. Rent and schools sit outside the score. The question is where you want to be next August.
What is the Urban Climate Index in this text?
The August 2026 reading for Sydney City Council, on the Tasman Sea: 18 zones, land surface temperature and official meteorological stations. This article shows the five best and the five worst; the full ranking downloads here.
Where is the full ranking?
The ranking of 18 downloads on this page: rank, zone and mean surface.
What is the 21.0°C on the cards?
The August mean surface for Sydney City Council, on the cards in this text. The zone ranking uses that same area.
Why does St Peters lead and Haymarket close?
August is winter in Sydney. St Peters sits first, at about 23.0°C, toward the south. Haymarket closes, at about 19.9°C. Five meteorological stations cover the 18 zones: humidity is the same, the air is almost the same, and rain and the ground set the difference.
Where does Surry Hills sit?
Surry Hills sits 10th of 18, at about 21.2°C, in the middle pack.
Talk to us about the climate of your city
If your city is not here, write with the place. We set up the ranking of barrios or zones.
Talk to us