
For people in the valley
River Pulse
The rain that floods your street is rarely the rain you saw fall. This reading follows the water from where it actually fell.
When a river leaves its bed, it is easy to blame the rain that fell on the town. Most of the time the cause is far away. The water that covers the plain fell days earlier, tens or hundreds of kilometres upstream, in the high part of the basin where the river begins.
That journey leaves four marks. Rain falls up high. The soil there fills and stops taking water in. The river rises past the height where flooding starts. The water leaves the channel and covers the plain. When the four show up in the same period, they stop being four separate facts and become one movement of the water crossing the basin. That movement is what we call a river pulse.
River Pulse reads the four signs over a period you choose, compares them with the same period the year before, and says how many of them showed up. We read any basin, any dates.
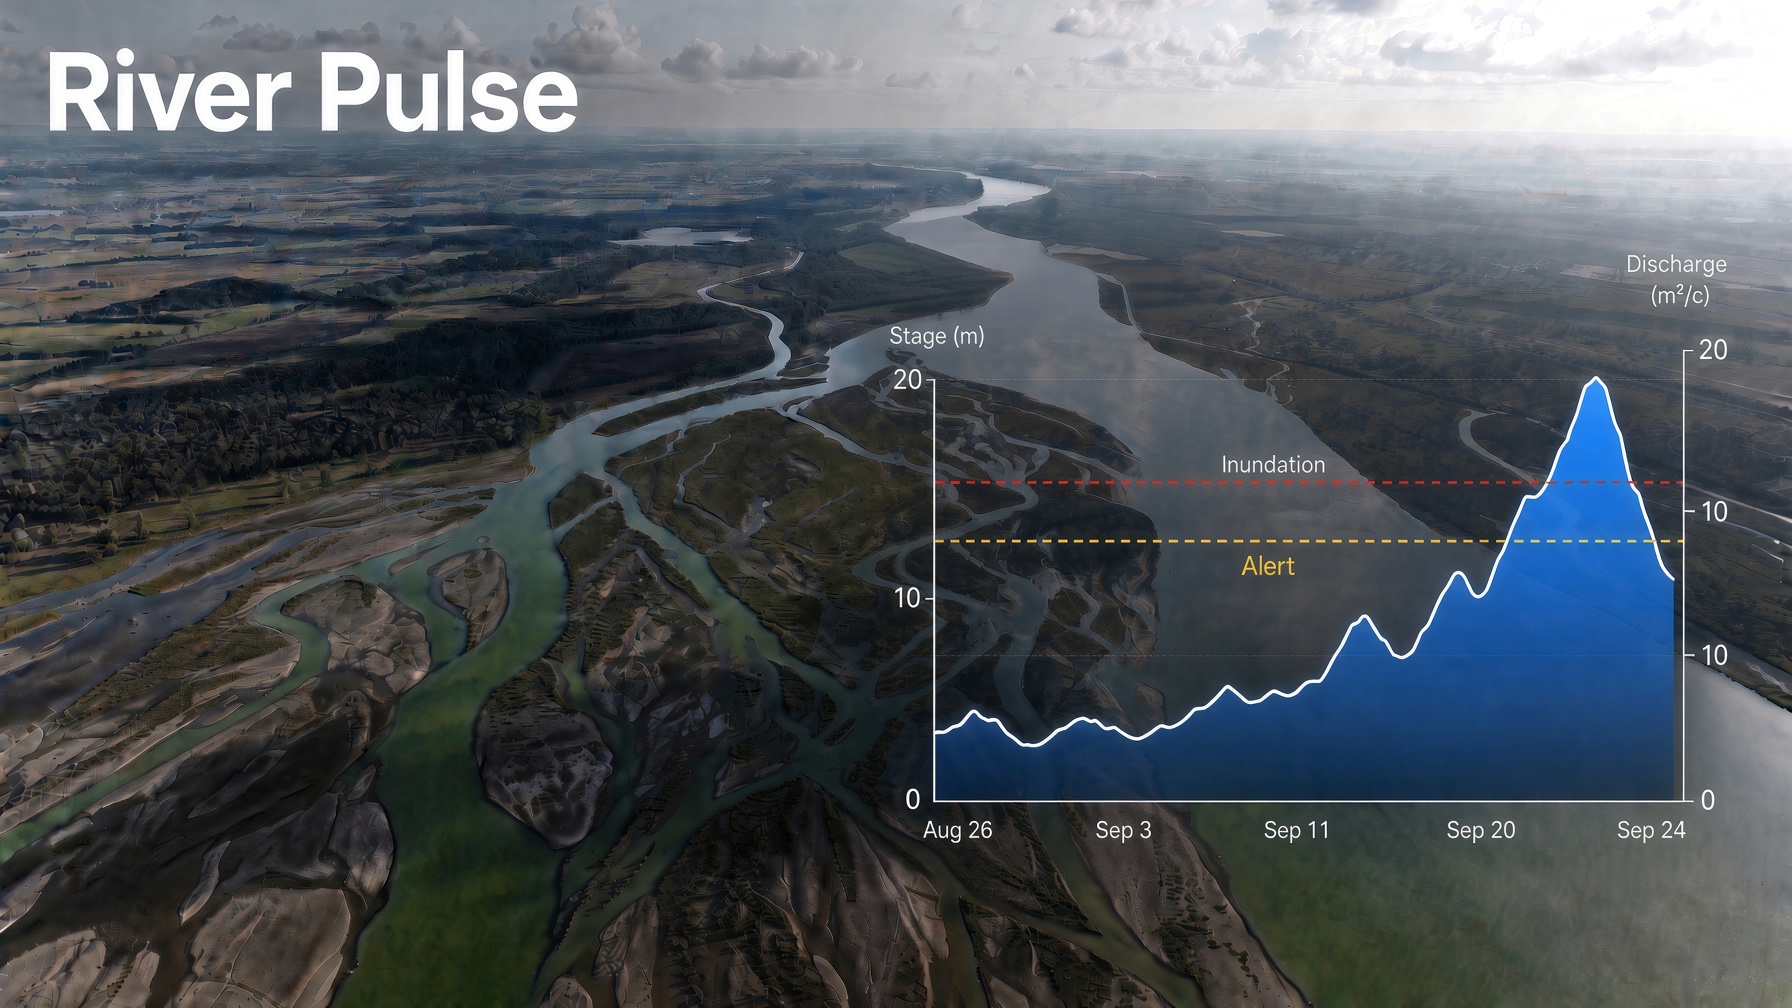
The river in its valley, stage and discharge from 26 August to 24 September, and the alert and inundation marks.
Four words before you start
The reading uses four terms the whole way through. Someone who does not work with rivers probably knows two of them.
- Basin
- All the ground whose rain ends up in the same river. A basin can cover thousands of square kilometres, and everything that falls on it travels to the same place.
- Headwaters
- The high part of the basin, where the river begins and where rain enters the system. It usually sits far from the towns in the valley, which is why someone living downstream does not see the rain that will reach the street.
- Plain
- The low, flat ground along the river, where the water goes when the channel cannot hold it. In ordinary weather it is dry, and that is where fields, roads and neighbourhoods are.
- Stage
- The height of the river in metres, read against a fixed staff at a gauge. It is not the depth of the water. Each gauge has two marks set by the agency that runs it: an alert, and a flood mark.
What the reading measures
Each sign is one stretch of the water’s path, and each one counts when it reaches the mark for its basin. The marks change from basin to basin. Under each sign, the mark for the Taquari Valley, the basin already published, is the worked example.
1. Headwaters rain
How much rain fell on the high part of the basin during the period. It counts in two ways: when the total reaches the basin’s mark, or when it beats the year before and includes at least one day of intense rain.
On the Taquari the mark is 180 mm in the period, and an intense day is a day over 50 mm.
2. Headwaters soil
How much water the soil up high was already holding when the rain arrived. Soil that can still take water in keeps some of it. Saturated soil sends almost all of it to the river. It counts when the mean for the period reaches the basin’s mark.
On the Taquari the mark is 0.40, on a scale where 0 is dry soil and 1 is soil full of water.
3. River stage
The height the river reached at the basin’s gauge. It counts when it reaches the flood mark set for that gauge.
On the Taquari the gauge is Estrela, with an alert at 17 m and a flood mark at 19 m.
4. Water on the plain
How much of the plain the satellite radar saw covered by water. It counts when the area is larger than in the same period the year before.
The measure is an area, square kilometres of ground covered. It does not estimate a volume of water.
Rain, soil and water are read over the whole of each stretch, not at one gauge or one point. A reading covers three places at once: the headwaters, the valley, and a strip of plain along the river inside the valley.
What the reading does not do
- It does not produce a flood map, and it does not model how the river flows. It shows what the sensors recorded in the period.
- It does not attribute the flood to a climate pattern. Saying it was El Niño, or any other pattern, takes an analysis this reading does not do.
- It does not forecast. Each reading describes a period that has ended.
- It is not the Urban Climate Index, which reads the monthly climate of a city, and it is not a vegetation reading of a dry landscape.
Who it is for
If you live in the valley or you work the land, the reading says whether the headwaters, the river and the plain moved together in that period, and at what marks. It is a way to see what happened with a precision memory does not give: how much rain actually fell up high, how many days the river stayed out of its bed, how much ground was covered.
For someone running a municipality or an operation, the same reading shows where the water formed and how long it took to come down. That interval, between rain in the headwaters and water in the street, is the warning time the basin gave.
We read one period at a time. The rain mark, the soil mark and the flood mark belong to the basin being read, and they are published with the date on each reading, next to the numbers that support them.
How to read the count
The reading looks back. It takes a period that has already ended and says what happened in it. The count describes a fact, not a chance of something still to come.
- 1 of 4 — isolated wetness, no pulse.
- 2 of 4 — the signs are mixed, still no pulse.
- 3 of 4 — one sign is missing, and the reading stays open.
- 4 of 4 — there was a pulse. Headwaters rain, the soil, the river and the plain moved in the same period.
The four signs together are what entitles the name, because that is what shows the basin working as one system. Heavy rain alone is not enough, and a high river alone is not enough either. The first can sink into the soil before it reaches the channel. The second can be a rise that never left the channel.
The marks and the numbers for each basin sit on the dated reading, in our blog.
What a 4 of 4 does not say
The count measures the link between the parts of the basin. It does not measure the size of the flood. A 4 of 4 says the mechanism was complete, and the stage, published in each reading, says how high the river got.
In the Taquari Valley, the September 2026 reading took Estrela to 24.46 m, five and a half metres above the flood mark, for three days. This valley has seen the water higher. The same count would fit a larger flood. The stage is what answers for the height.
Latest readings
The dated reading publishes the marks and the numbers.
Where the name comes from
Ecology has studied this movement since 1989, when Junk, Bayley and Sparks described the flood pulse. The central idea is that the periodic flood is not an accident of the river and the plain. It is what keeps that system going: the pulse fertilises the soil, feeds the fish and sustains life on the plain. In Brazil the term is pulso de inundação.
We say river pulse out of fidelity to that idea, and so the name is easy to hold. The word flood carries disaster, and the measurement on its own does not claim a disaster. It claims that the basin moved as one system. When there is a disaster, the stage is what says so, and the stage comes in the same reading.
Junk, W. J.; Bayley, P. B.; Sparks, R. E. (1989). The flood pulse concept in river-floodplain systems.
Related in the platform
Questions
What is a river pulse, in one sentence?
It is when rain in the headwaters, saturated soil, the rise of the river and water on the plain happen in the same period, so the flood stops being a local episode and becomes a movement of the whole basin.
So is this a flood warning?
No. Each reading covers a period that has already ended and describes what happened in it. For a warning in real time, the agency that runs the gauges on your river is the source.
Does a confirmed pulse mean it was a large flood?
No. It says the mechanism was complete. The stage answers for the height, and it is published in each reading. In the Taquari Valley, September 2026 reached 24.46 m at Estrela.
Why compare with the year before?
Because a number on its own says little. Knowing that 365 mm of rain fell says little to someone who does not keep averages in their head. Knowing that it was more than double the year before, in the same weeks, does. The year before is the reference the reader lived.
Where do the data come from?
Rain, soil and water on the plain come from satellite data: rain as a daily mean in cells of about 11 km, soil as a mean for the period in cells of about 9 km, and water from radar, with a pixel of about 20 m. Stage and discharge come from the agency that runs the basin’s gauge. On the Taquari, that is the ANA service.
Can my basin be read?
Yes, as long as there is a gauge with a defined flood mark. Write with the place and the dates, and we set up the reading of headwaters, river and plain.
If your valley is not here
We read one period at a time, for the people who live in that valley. Write with the place and the dates, and we set up the reading of headwaters, river and plain.