
For people on the coast
Marine Climate Signal
The Marine Climate Signal sums, for a window you choose, whether the sea carried a marine heatwave and whether the water off the coast looked murkier than usual. The result is a traffic light: green, yellow or red. Clarity is optical. It does not speak of bacteria or bathing-water law. We publish coastal readings when the analysis is ready. In October 2026 the Cádiz coastal strip showed a yellow signal: +1.31°C vs 1971–2000 and a 25-day marine heatwave.
Three maps from the Cádiz coastal reading, October 2026.
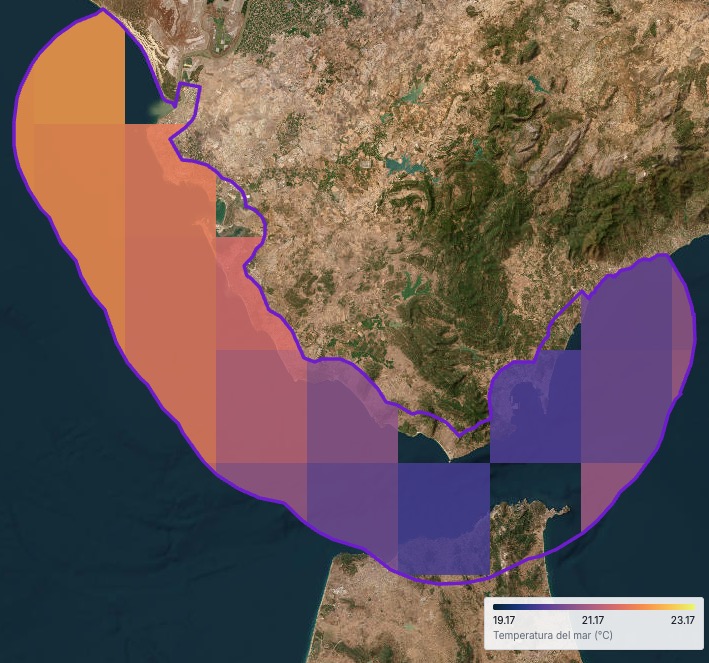
Sea surface temperature, 2–31 October 2026 on the Cádiz coastal strip.
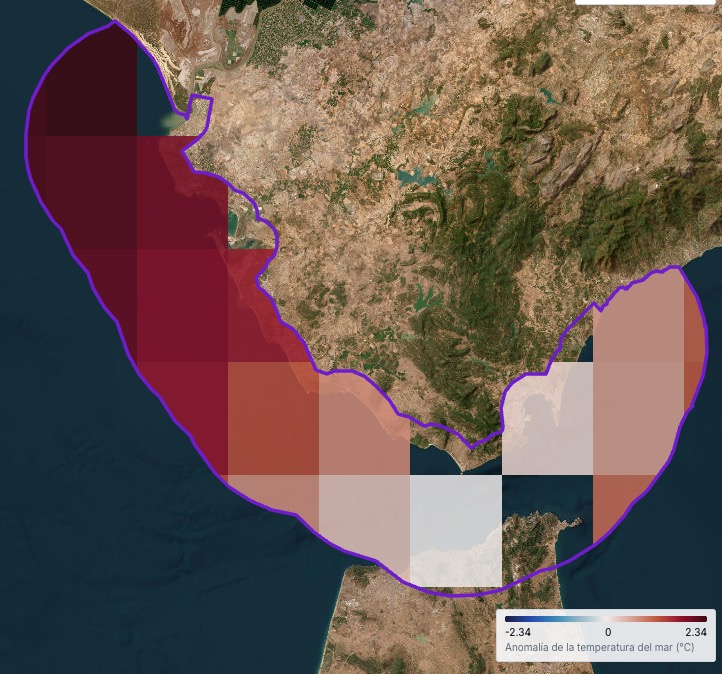
Sea temperature anomaly vs 1971–2000 in the same period.
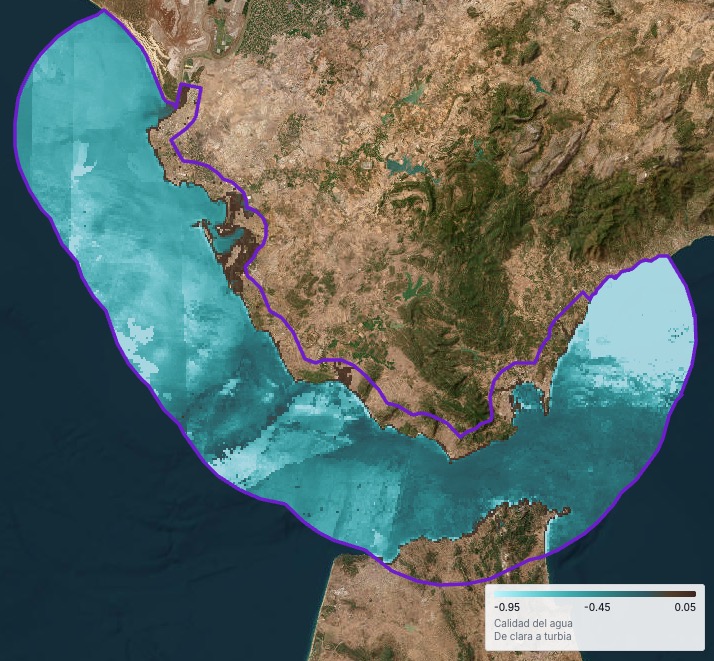
Optical water clarity, 2–31 October 2026 off the coast.
What it measures
- Whether a marine heatwave occurred in the window. It is a heat event in the sea, not a single snapshot.
- Optical water clarity: the usual range (10th to 90th percentile) of cells off the coast, compared with the balance at zero.
- A green, yellow or red traffic light from those two readings.
What it does not measure
- Bacteria, toxic algae or EU bathing-water rules. Clarity is optical only.
- The Urban Climate Index, which ranks city neighbourhoods on land.
- The River Pulse, which follows water moving through a basin.
- Weather still to come. That is TrueWind or the board on Live.
Where it applies
A bay, harbour, beach or stretch of coast you want to read for a given period.
It compares windows and shows when heat and clarity worsened together. It does not replace a lab sample.
The traffic light
Green, yellow or red come from marine heat and usual water clarity. Full rules are below on this page.
Green
No marine heatwave in the window and usual water clarity (P10–P90) sits on the clear side of the balance at zero: not murkier than the balance.
Yellow
Only one of the two readings is bad: there is a marine heatwave or usual water is murkier than the balance at zero, but not both.
Red
Both readings are bad: there is a marine heatwave and usual water (the middle 80% of cells) is murkier than the balance at zero.
Methodology
Marine heat
In the window you set we look for a marine heatwave event: anomalous heat in the sea off the coast, not a single spot temperature.
Heat anomaly is compared to the 1971–2000 reference period. That shows whether that span moved away from what was usual on those dates.
Water clarity
Clarity is optical. It measures how murky the water looks in cells off the coast, not bacteria or bathing safety.
We take the usual central range of cells, from the 10th to the 90th percentile (the middle 80%), and compare it with the balance at zero between clearer and murkier water.
If that usual range sits on the murky side of the balance, the water reading is bad. If it sits on the clear side or at the balance, it is good.
Window and publication
Each reading names the place, start and end dates and the resulting traffic light.
We publish when the analysis is ready. Figures and maps live in the dated blog note; this section explains how the signal is read.
Latest readings
See the latest Marine Climate Signal reports
Related on the platform
Meteorology
Stations and sensors on the map. Wind and air on the coast sit in the same picture as the marine signal.
Live
Shared board with stations and forecast. Useful when the coast already has its own network.
TrueWind
Wind and weather still to come. The marine signal describes a window that has ended.
Questions
What is the Marine Climate Signal?
A green, yellow or red summary of sea heat and optical water clarity for a coastal window you choose.
Does it say if bathing is legal under EU rules?
No. It does not measure bacteria or apply the bathing-water directive. Clarity is optical only.
What is the heat anomaly compared to?
The 1971–2000 reference period. That shows whether sea heat in the window moved away from what was usual.
How is it different from the Urban Climate Index?
The urban index ranks city neighbourhoods on land. The marine signal reads sea and coast for the window you set.
What counts as a marine heatwave?
A recognised marine heat event in the window: the sea warms above what was usual vs 1971–2000, not an isolated spike without context.
Why the 10th and 90th percentile?
They describe usual water across most cells off the coast, without letting one extreme alone drive the traffic light.
Can it be green with locally murky water?
The traffic light uses the usual range across the whole coastal window. A very small stretch may not move the result. The dated note shows the map.
Where do the data come from?
From the same Earth observation and marine stack that feeds the rest of Neometrico. Visitor copy does not name missions or product brands.
If your coast is not here
Write with the place and the window. We publish the signal when the analysis is ready.